Waveform
Overview
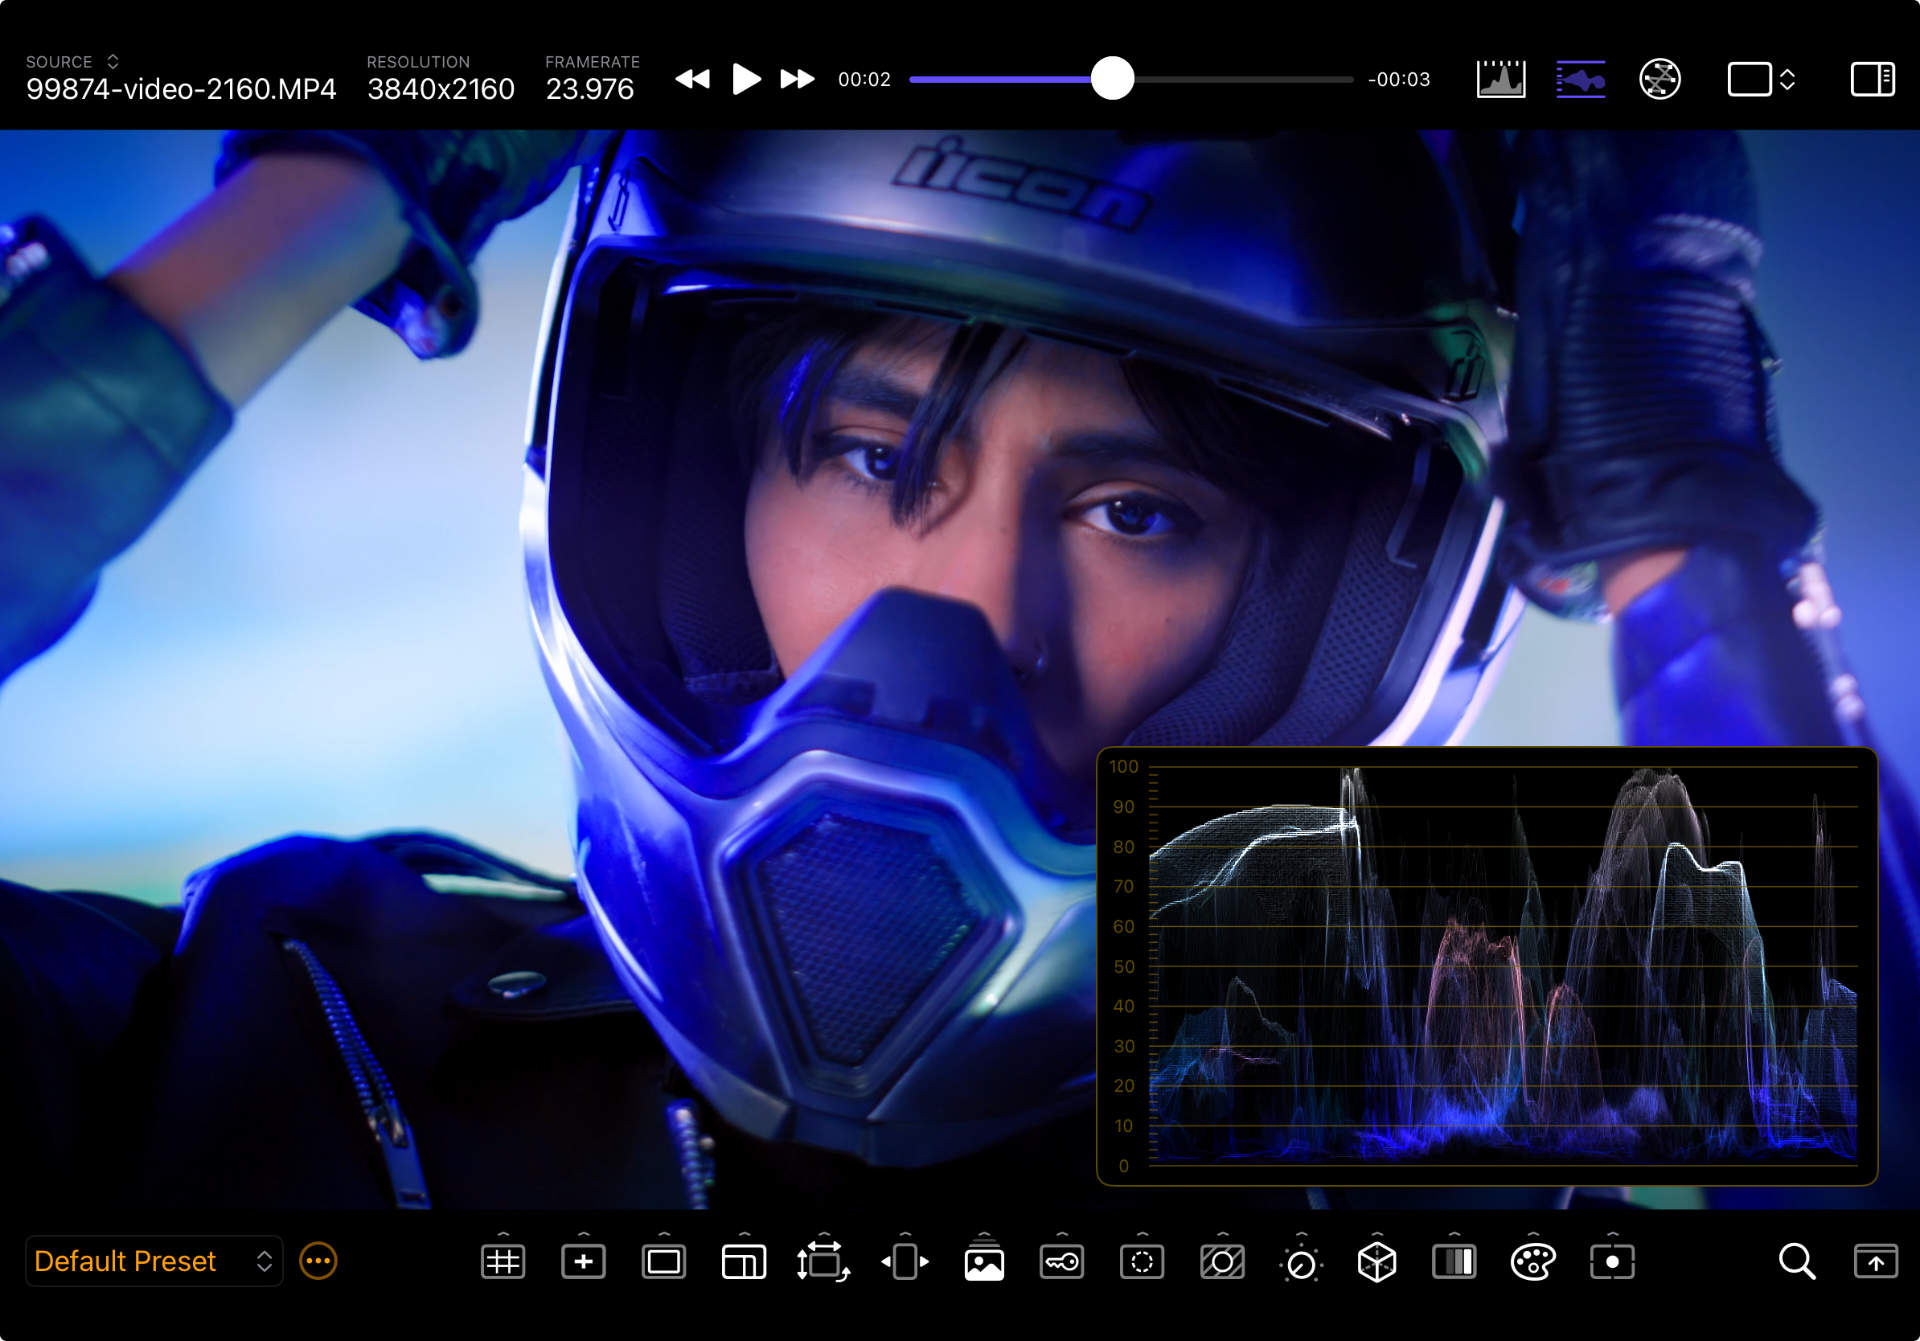
The Waveform Monitor is a flexible exposure measurement instrument that displays a two-dimensional histogram of the image. Each pixel column represents a Luma histogram of the corresponding input image pixel column, where the height of the pixel represents the luma value (0 at the bottom to 100 at the top) and the intensity represents the histogram value.
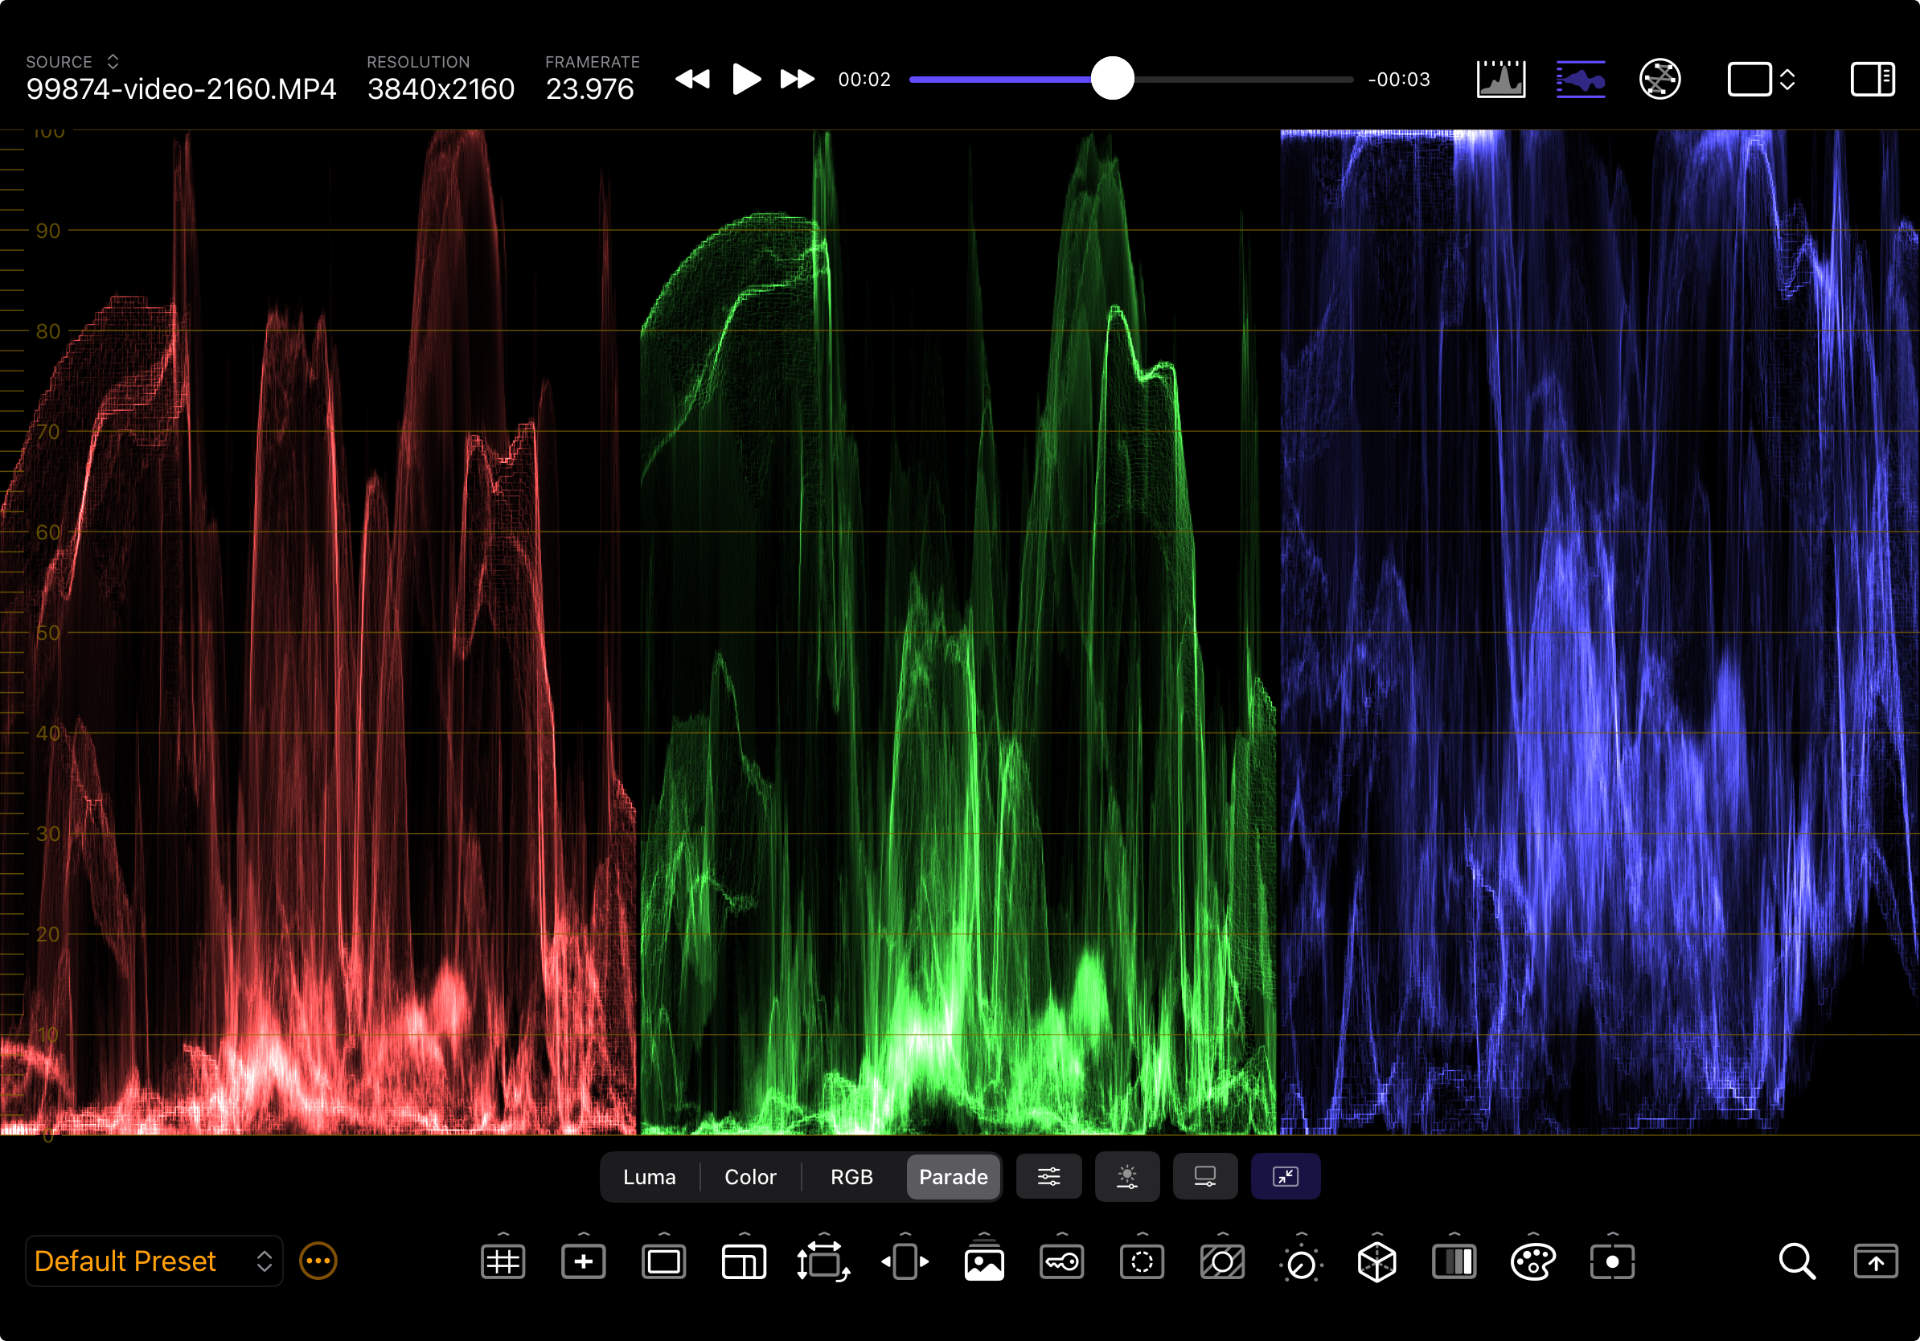
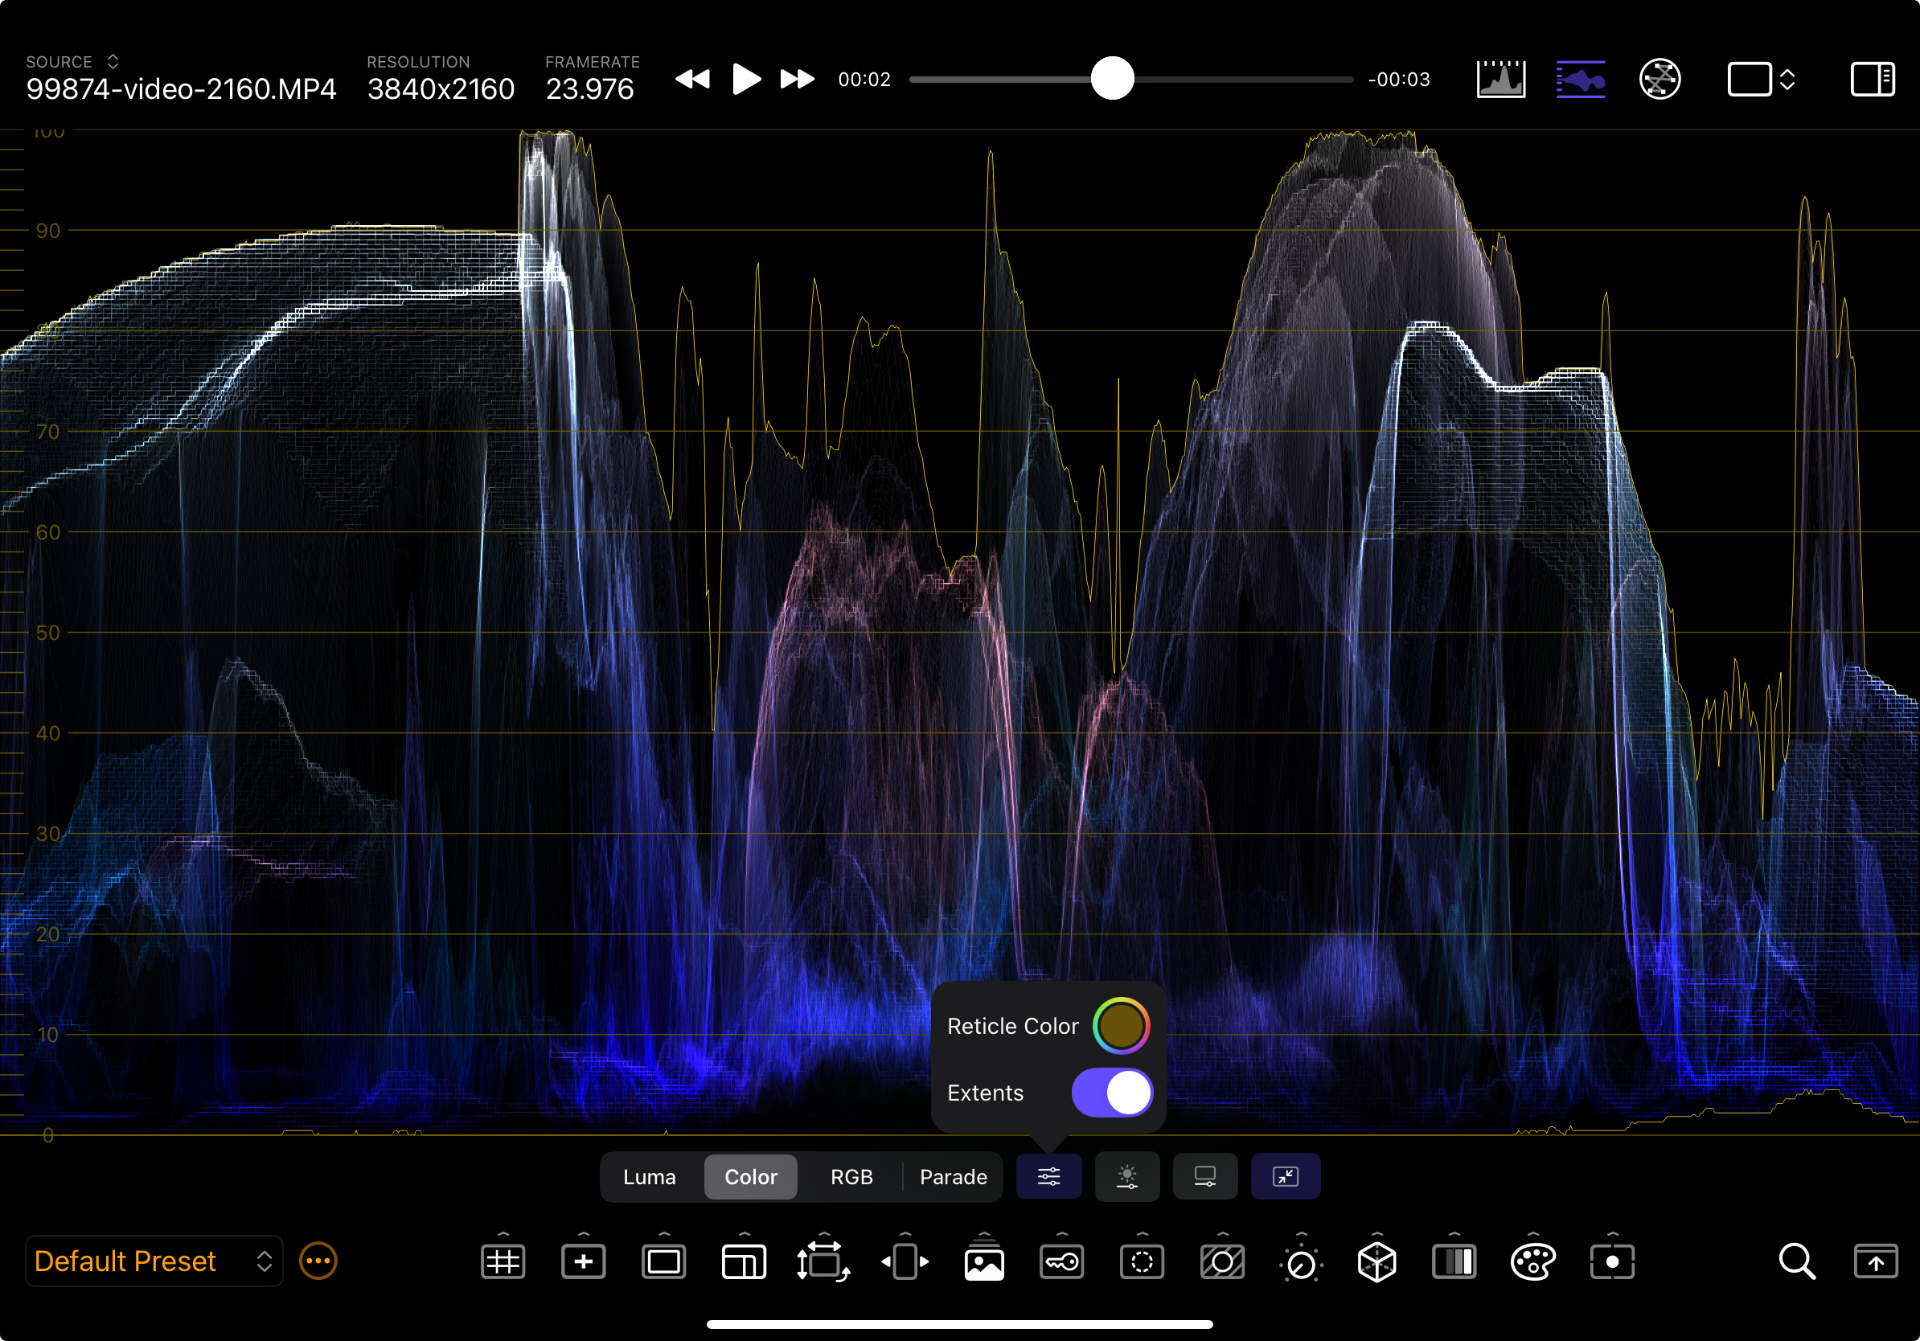
Double-click/tap in the window to open the Waveform Monitor settings bar. There are four types of Waveform displays: Luma, Colorized, RGB, and Parade. You can toggle the display of the signal’s envelope extents and adjust the trace brightness, in addition to the size and display controls of the floating window.
Where the Histogram shows how much brightness exists, the Waveform shows where that brightness sits across the image width. Shadows anchor at the bottom of the graph, highlights at the top.
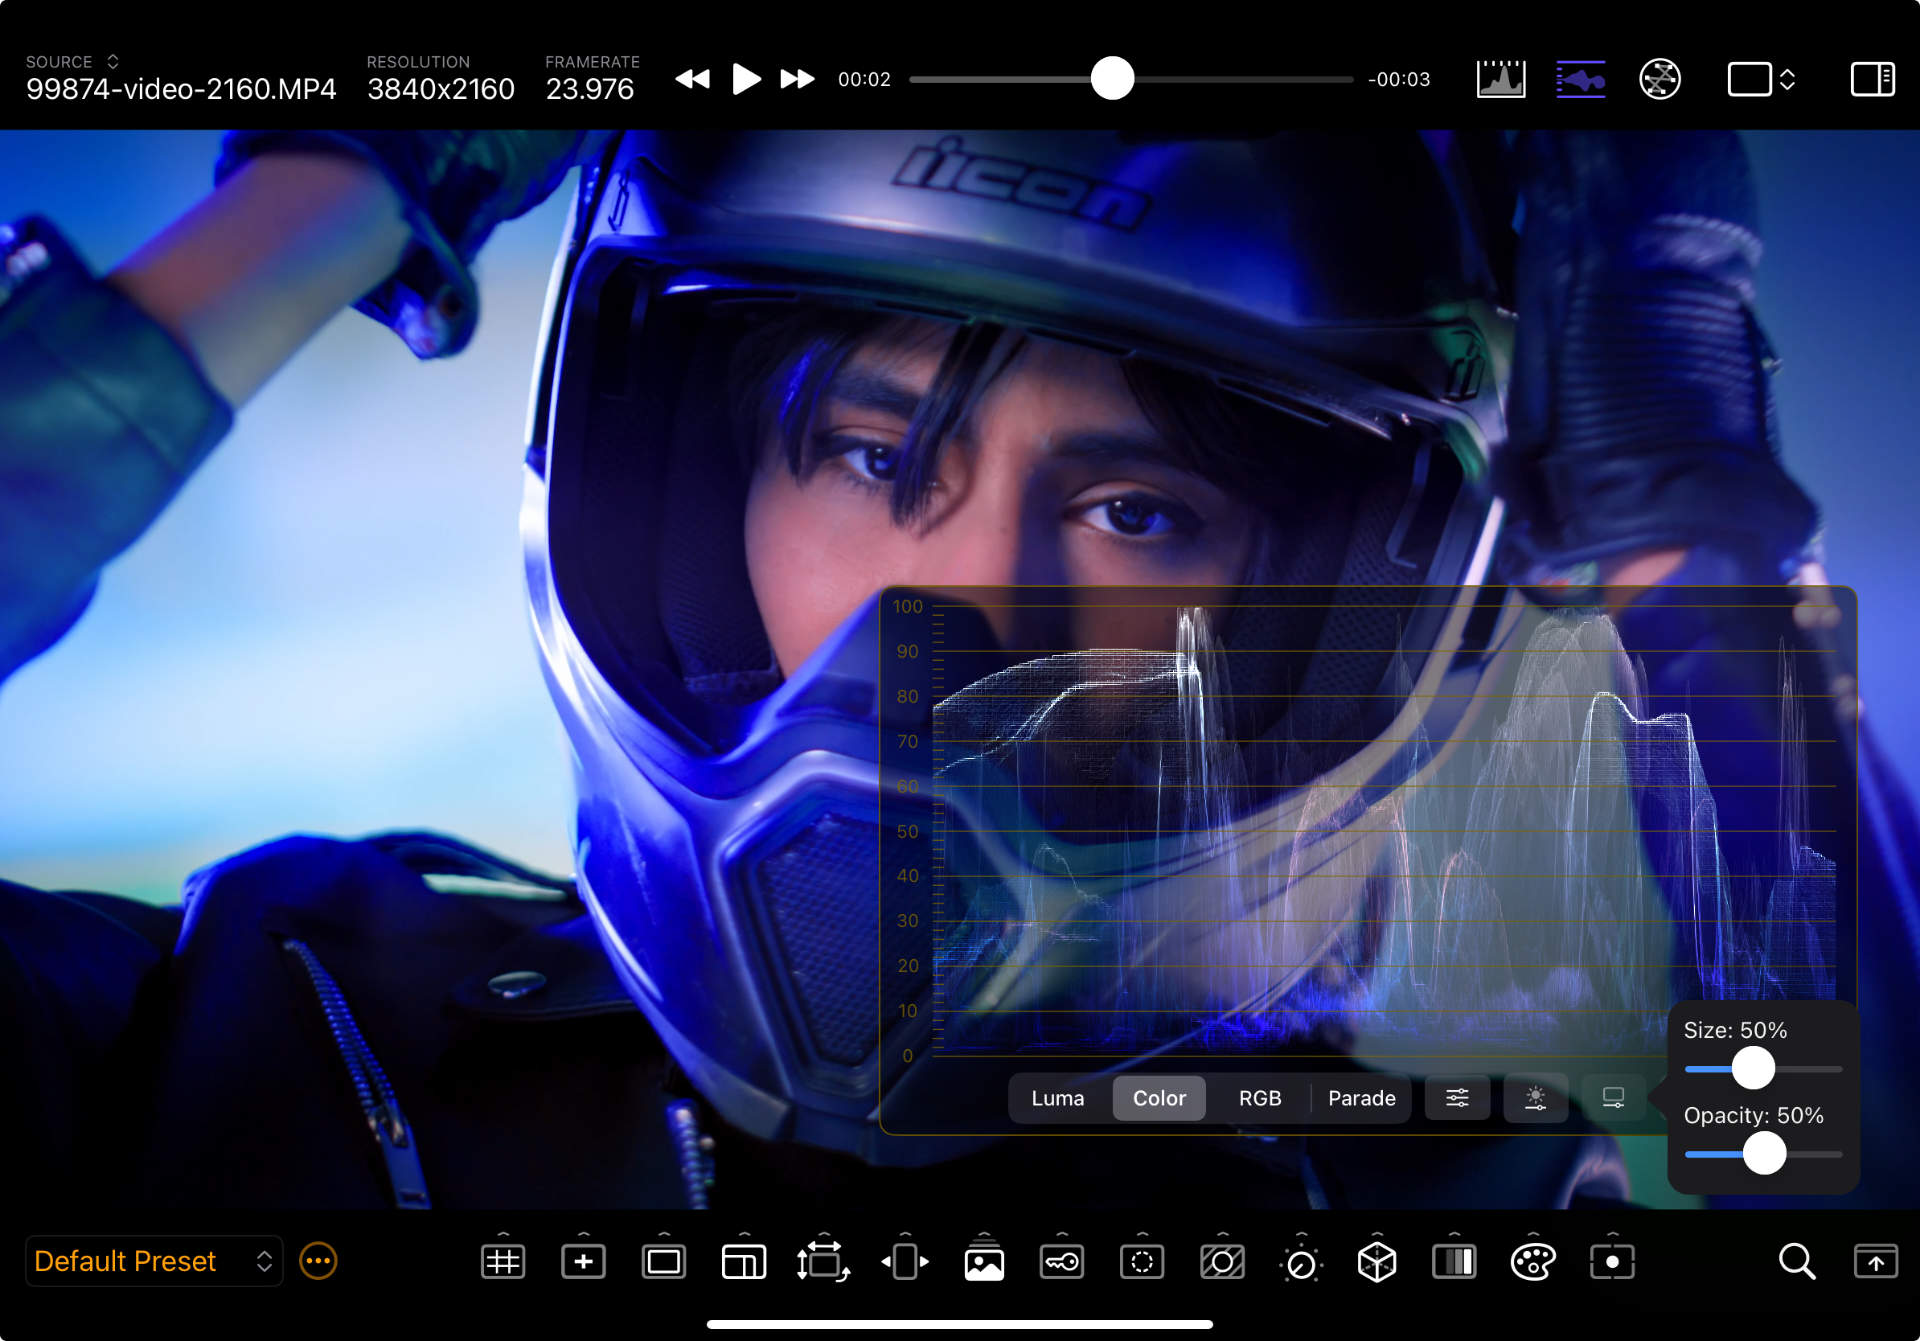
If you’re new to Waveform Monitors, try making it full screen and lowering the opacity of the floating window background to see the scope overlayed on the input image. This can help visualize the relationship between the original image and the scope trace.
Settings
| Setting | Options | Description |
|---|---|---|
| Display Mode | Luma/Colorized/RGB/RGB Parade | Select the waveform display mode. |
| Scope Settings | Reticle Color | Customize the color of the reticle. |
| Extents | Show an envelope of the min/max luma values that might otherwise be difficult to see on the trace. | |
| Trace Brightness | Slider | Configures the brightness of the waveform trace. |
| Window Settings | Size | Adjust the size of the floating window. |
| Opacity | Change the transparency of the floating window background. | |
| Full Screen | - | Make the floating scope full screen. |
RGB Parade can help with white‑balance: wherever the three waveforms are aligned the color will be neutral.